Saving Seafood

  • Home
  • News
    • Alerts
    • Conservation & Environment
    • Council Actions
    • Economic Impact
    • Enforcement
    • International & Trade
    • Law
    • Management & Regulation
    • Regulations
    • Nutrition
    • Opinion
    • Other News
    • Safety
    • Science
    • State and Local
  • News by Region
    • New England
    • Mid-Atlantic
    • South Atlantic
    • Gulf of Mexico
    • Pacific
    • North Pacific
    • Western Pacific
  • About
    • Contact Us
    • Fishing Terms Glossary

Shark Depredation Tripled in 20 Years of Longline Survey

October 20, 2026 — Depredation, the removal of or damage to hooked fish or gear by sharks or other marine predators, is a growing concern among fishing communities. Depredation results in increased mortality for managed fish stocks, economic loss, and degraded fishing experiences.

NOAA Fisheries biologists Dr. William “Trey” Driggers and Dr. Walter Ingram recently analyzed data from the Southeast Fisheries Science Center’s Bottom Longline Survey. Their goal: to determine trends in depredation rates over the past two decades. This is one of the first fishery-independent analyses of shark depredation—most research has been conducted in the fishery. The data confirm what anglers are seeing on the water: increasing trends in depredation by species like sandbar, blacktip, bull, and tiger sharks. 

History of the Bottom Longline Survey

The annual Bottom Longline Survey, which started in 1995, samples U.S. waters of the Atlantic Ocean, including the Gulf of America, from Brownsville, Texas, to Cape Hatteras, North Carolina. Scientists use these data to monitor trends in abundance of federally managed sharks and other fish species like red snapper. It provides fishery-independent indices of abundance for numerous federal stock assessments in the Southeast region. When the survey protocol was standardized in 2001, Dr. Driggers recognized the importance of collecting data on depredation events. He added it as a standard data collection metric for the survey.

Since 2005, the survey has collected data on:

  • Whether depredation occurred
  • Predator species preying on the hooked catch, when possible
  • Species of the depredated catch
  • Variables like location, depth, temperature, and salinity

This has resulted in a standardized record of depredation events for all survey longline sets for more than two decades.
Read the full article at NOAA Fisheries

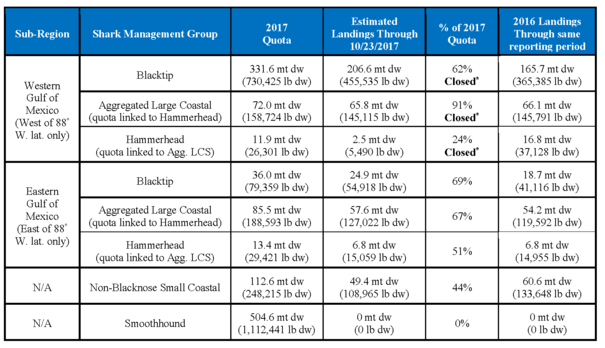
Shark Landings Update Through October 23, 2017

October 27, 2017 — The following was released by NOAA Fisheries:

The following are preliminary landings estimates in metric tons (mt) and pounds (lb) dressed weight (dw) for the Atlantic shark commercial fisheries; 1 mt is equal to 2,204.6 pounds.  These preliminary estimates are based on dealer reports and other information received from January 1 through October 23, 2017.  The estimates include landings by state-only permitted vessels, federally permitted vessels, and the 2017 shark research fishery participants.  We provide percentages of landings instead of estimated landings where needed to continue ensuring participant confidentiality.  The fishing seasons for all shark management groups opened on January 1, 2017, except for the aggregated LCS, blacktip shark, and hammerhead shark management groups in the western Gulf of Mexico sub-region which opened on February 1, 2017.

Gulf of Mexico Region

  • Includes any landings south and west 25° 20.4’ N. long.
  • As of 10/23/2017, the retention limit for directed permit holders is 45 large coastal sharks other than sandbar sharks per vessel per trip in the eastern Gulf of Mexico sub-region and no retention of large coastal sharks in the western Gulf of Mexico sub-region*.
  • The retention limit for directed permit holders can change throughout the season.

GOM

* Fishery closed at 11:30 p.m. local time on May 2, 2017 (82 FR 20447).

NMFS will announce closures of management groups when landings reach or are projected to reach 80 percent of the quota.  Management groups that are quota linked close when landings of either of the linked management groups reach or are projected to reach 80 percent of the quota.

For the full list of shark landings by region visit NOAA Fisheries

Recent Headlines

  • Virginia Menhaden Fishery Welcomes VIMS Dean Derek Aday’s Call for Science to Guide Chesapeake Bay Decisions
  • New NOAA Rule Helps Fishing Crews Reduce Whale Entanglements and Save Time
  • ‘We’re All Commercial Fishermen’: Maine and Virginia Stand Together on Menhaden
  • Shark Finning Bans Aren’t Stopping Shark Mortality. Here’s Why.
  • US data shows shark depredation tripled in Gulf, Southeast Atlantic over 20 years
  • ALASKA: Alaska seafood harvesting jobs are up for the first time since 2019
  • Revolution Wind fully operational, Ørsted reports
  • Maine, Virginia fishermen unite against further menhaden quota cuts

Most Popular Topics

Alaska Aquaculture ASMFC Atlantic States Marine Fisheries Commission BOEM California China Climate change Coronavirus COVID-19 Donald Trump Florida groundfish Gulf of Maine Gulf of Mexico IUU fishing Lobster Maine Massachusetts Mid-Atlantic National Marine Fisheries Service National Oceanic and Atmospheric Administration NEFMC New Bedford New England New England Fishery Management Council New Jersey New York NMFS NOAA NOAA Fisheries North Carolina North Pacific offshore energy Offshore wind Pacific right whales Salmon South Atlantic Virginia Washington Western Pacific Whales wind energy Wind Farms

Daily Updates & Alerts

Enter your email address to receive daily updates and alerts:

  • This field is for validation purposes and should be left unchanged.
Tweets by @savingseafood

Copyright © 2026 Saving Seafood · WordPress Web Design by Jessee Productions