Saving Seafood

  • Home
  • News
    • Alerts
    • Conservation & Environment
    • Council Actions
    • Economic Impact
    • Enforcement
    • International & Trade
    • Law
    • Management & Regulation
    • Regulations
    • Nutrition
    • Opinion
    • Other News
    • Safety
    • Science
    • State and Local
  • News by Region
    • New England
    • Mid-Atlantic
    • South Atlantic
    • Gulf of Mexico
    • Pacific
    • North Pacific
    • Western Pacific
  • About
    • Contact Us
    • Fishing Terms Glossary

Retraction: Study of marine protected areas deemed flawed with conflict of interest

December 17, 2021 — Sometimes fishermen get lucky, and their complaints about flawed data get noticed by scientists. Such was the case with an article about Marine Protected Areas that’s been used to justify a new push for ocean zoning — including the recent 30×30 initiative to shutter up to 30 percent of the nation’s waters.

“A retraction is a Big Deal in science, especially from a prominent journal,” wrote Max Mossler in a post on the University of Washington’s Sustainable Fisheries UW.

It’s an even bigger deal — or should be — if that article is being used to position policy at the federal level.

The original piece, Mossler writes, “claimed that closing an additional 5 percent of the ocean to fishing would increase fish catches by 20 percent.” Some of the biggest titles in the mainstream press picked it up.

We’re talking End of Fish by 2048-level propaganda.

Read the full story at National Fisherman

Impacts of fishing forage fish on the fish that feed on forage fish

June 7, 2021 — Small pelagic fish that school in open water—think sardines or anchovies, are eaten by all kinds of predators. Seabirds, marine mammals, and bigger fish feed on these small pelagics giving them the moniker “forage fish.”

Forage fish support several fisheries, particularly “reduction fisheries,” where fish are caught and reduced into fishmeal and fish oil for livestock and aquaculture. The anchoveta fishery off the coast of South America is the largest in the world, and nearly all catch is reduced. From a food production perspective, reduction fisheries turn fish that humans don’t like to eat into other kinds of meat that humans do. That isn’t to say forage fish aren’t fished for human consumption—they are and have one of the lowest carbon footprints of any food, but the majority of catch is reduced. Eat more anchovies and sardines, people!

However, forage fish also play a foundational role in many ocean ecosystems. They buoy the diets of marine birds and mammals like whales, puffins, albatross, and other vulnerable species while also indirectly supporting valuable fisheries, e.g., salmon and tuna feed on forage fish. Their role in the food chain has led to some calls to limit forage fish fisheries to boost the populations of their higher-value predators. This makes intuitive sense, but new research out this week by Free et al. shows it’s more complicated than simply “more prey, more predators.”

In 2012, a prominent forage fish paper was published that advised a highly precautionary approach to commercial fishing of forage fish. They suggested that to be as conservative as possible, even fisheries currently considered well-managed should be reduced by 50% to enhance and maintain predator populations. It kicked off a decade of forage fish population modeling and scientific discussion. The major criticism of the 2012 paper was that the ecosystem model used in the paper assumed that commercial fishing had an outsized impact on forage fish populations and did not account for ocean conditions. However, forage fish populations are highly sensitive to environmental conditions. For example, long before humans were fishing them, the Pacific Sardine went through periods of significant population boom and bust. This environmental sensitivity complicates the understanding of fishing impact, especially because the predators eat far more forage fish than are taken via fishing. Surly overfishing is bad, but would further reducing fishing below sustainable levels benefit the broader ecosystem?

Scientists did more research. In 2017, a paper by Hilborn et al. showed little correlation between forage fish populations and their predators. The authors argued that if forage fish have natural boom and bust cycles, their predators should have the resilience to find other kinds of prey in times of bust (and indeed, most marine predators that forage on small pelagic fish have a broad diet and are highly mobile). Hilborn et al. challenged the 2012 paper’s recommendations for a highly precautionary approach to forage fish fisheries. However, it was still a relatively simple analysis—the authors used population data to show correlations (or the lack thereof) between the abundance of forage fish and changes in their predator populations. They found that just 5 of the 50 predators examined in that study showed a positive correlation to forage fish population.

The 2017 paper showed correlation but not causality—the paper published this week gets closer to causality by controlling for possible confounding factors, namely by using a predator dynamics model that accounted for forage fish boom and bust cycles. This hadn’t been in previous models. Further, the 2017 paper only looked at U.S. ecosystems; this paper included ecosystems in Europe, South Africa, and the Humboldt Current off South America, giving a more global view of forage fish ecosystem dynamics.

Read the full story at Sustainable Fisheries UW

Ray Hilborn on the role of industry funding

April 12, 2021 — It is true that my research program receives funding from the fishing industry. Industry funding makes up about 22% of my total funding, while I receive similar amounts from environmental foundations, Universities, and private individuals unassociated with the fishing industry. In addition, I receive funding from environmental NGOs, including over the years the National Resources Defense Council, The Nature Conservancy, Environmental Defense Fund, and the Pew Institute for Ocean Science.

Here is my response to those who say this means you should not believe what I say about fisheries:

Science is collaborative, not individual

When I say that all fish will not be gone by 2048 or that fish stocks are increasing in abundance in much of the world, these are not personal opinions, but results of scientific papers authored by a large group of people, each of whom stands by the results of the paper.

When the claim that “all fish would be gone by 2048” came out, the lead author on that paper, Boris Worm, and I agreed to meet together to understand why we had different perspectives. We organized a group of about 20 scientists and looked at trends in fish stock abundance where it was measured and found no sign that these stocks were generally declining. In 2009, we published a paper in Science Magazine showing this, and the lead author was Boris Worm. It is absurd to say that because I, one of 21 authors, had received funding from the fishing industry this work was biased.

I was the first author on the 2020 follow-up paper in Proceedings of the National Academy of Sciences, Effective fisheries management instrumental in improving fish stock status, that showed that fish stocks were actually increasing in much of the world, but this paper had 23 authors, including professors from several different universities, an employee of The Nature Conservancy, a member of the Board of Directors of The Nature Conservancy, a member of the Board of Directors of Environmental Defense, and an employee of the Wildlife Conservation Society all of whom stand by our conclusions. It is not my work, but group work, and where I get some of my funding is largely irrelevant.

Almost every paper with my name on it in fisheries has a range of authors and many of them have at least one author representing conservation organizations.

Look at the data and what was actually done

My research is not cloaked in secrecy. In every research paper I have been a part of, we tell the reader what data we used and how we used it to get the results we did. This is the methodology section. We describe our data and methods so you, or anyone else, can redo and/or verify the analysis.

This is an important part of science. I have criticized the methodology section of others before, and others have criticized mine—this is what makes information evolve closer to truth. Unfortunately, that part of science gets lost in press releases and hyperbolic headlines, which was a large reason I started this website—to explain the methodology sections of important fisheries papers to give the public (and journalists) proper context. For example, we have been highly critical of Oceana’s seafood fraud methodology on this website, but we appreciate the work they do and gave them a platform to respond to our criticism.

Read the full story at Sustainable Fisheries UW

From science to fake news: How ocean misinformation evolves

February 25, 2021 — The following was released by Sustainable Fisheries UW:

We have seen this cycle play out in fisheries with the headline that there won’t be any fish in the ocean by the year 2048. It started in 2006 when a group of scientists published a paper with the fun fact that at the rate of fisheries decline from decades ago, there would be no fish by 2048. It was a small part of the paper, meant to highlight a broader point that past fisheries management had been poor. However, the press release that accompanied the paper touted it as a significant finding leading to context-lacking news stories, hyperbolic headlines, and a pervasive notion that there won’t be any fish in the ocean by 2048. The paper’s original authors have stated that their findings are misconstrued and have worked to publish papers correcting them.

Brandolini’s law states that, “The amount of energy needed to refute bullshit is an order of magnitude larger than to produce it.” Fifteen years later, the 2048 myth continues to appear in articles across the internet.

The evolution of a bycatch myth

Now a new myth is rising to prominence: that global bycatch rates are as high as 40%.

Some background: The global authority on world fisheries, the United Nations Food and Agriculture Organization (FAO), defines bycatch as, “the total catch of non-target animals.” This is the widely accepted definition.

Bycatch can be a useful indicator of fishery impacts on the broader ecosystem and provides important data that fishermen and fishery managers use to improve sustainability. Different fisheries have different rates of bycatch with varying degrees of impact. However, an important nuance is that bycatch is used or discarded. Used bycatch is generally accepted as sustainable so long as the non-target species isn’t a threatened species. Discards are wasteful and an unfortunate reality of food production. The most recent research showed that about 10% of fish have been discarded at sea over the past decade.

So how did 10% get inflated to 40%?

In 2009, three people working for NGOs (World Wildlife Fund & Dorset Wildlife Trust) and one unaffiliated person decided to write a paper arguing that the definition of “bycatch” needed to be redefined to include ALL catch from unmanaged fisheries. From their paper:

“The new bycatch definition is therefore defined in its simplest form as: Bycatch is catch that is either unused or unmanaged.”

The authors define “unmanaged” as catch that “does not have specific management to ensure the take is sustainable;” in contrast, a managed fishery will have “clearly defined measures specifically intended to ensure the sustainable capture of any species or groups of species within any fishing operation.” An example they gave in the paper is that, because a 1993 study showed that members of the Indian bottom trawling fleet used nets with illegal mesh, “such a fishery cannot be considered managed, as defined in this paper, [thus] the entire catch of the Indian bottom trawl fleet is considered bycatch.” By their definition, they calculated 56.3% of India’s total catch as bycatch.

Adding up all this calculation for each country brought them to declare 40.4% of the world’s catch as bycatch.

Researchers making arguments in the scientific literature is nothing new. Still, it is surprising to see peer-reviewers and editors accept a paper arguing for redefining a widely accepted and common term that would necessitate a paradigm shift in fishery management. Especially with assumptions that a 1993 finding applied to a 2009 definition.

Regardless, their new definition has not been adopted. FAO still uses the widely accepted definition of bycatch, and I could not find a single authoritative body that uses the WWF & Dorset definition.

However, if you thought the redefined, inflated numbers would lose the nuance of “unused or unmanaged” and would be used as a call to action by advocacy groups, you are correct.

Read the full article here

The science of sustainable seafood, explained

January 13, 2021 — The following was released by Sustainable Fisheries UW:

Commercial fishing is vital to global food production. Wild-caught fish contain every essential amino acid, require no land or freshwater, and are a renewable resource when managed sustainably. In addition to providing access to healthy, low-impact protein, the seafood industry is worth over a trillion dollars annually and employs 40 million people—ensuring its sustainability is vital to economies all over the world. We explain seafood industry regulations in our section on fishery management—but first, the fundamental key to understanding sustainable seafood is grasping the science of catching fish.

Fisheries are composed of fish stocks and the fishing fleet that catches them. A fish stock is simply a harvested population. It refers to one specific species in one particular place, like Gulf of Maine cod. A fishery is the intersection of a stock (or group of stocks) and the means of harvest. Fishing fleets can use several different methods to capture fish, each method describes the fishery and guides management.

A fishery is sustainable when the amount harvested does not compromise future harvests.

Fishery science is the process that answers that question, primarily through stock assessments. A stock assessment uses several different kinds of data to understand the health of a stock and determine how much can be fished. You can think of the data as the A,B,Cs of stock assessments – abundance, biology, and catch.

  • Abundance is how many fish are in the population; estimates of abundance are made based on samples that are gathered using various methods.
  • Sampling can also collect biological data such as: age and length from which we can estimate levels of natural mortality and fishing mortality. Together, these data help estimate the reproductive rate of a population, which in turn allows us to predict how many fish will be around next year.
    • During sampling, environmental data like temperature, salinity, dissolved oxygen and other ecological variables are also collected.
  • Catch data are our historical records of how many or what weight of fish was caught during a calendar year or a fishing season.

Read the full release here

New Map Launching Today Helps People Find Local Seafood

May 28, 2020 — The seafood industry relies heavily on restaurants and retail stores for the majority of sales. With restaurant closures and coronavirus shelter-in-place orders, the seafood industry has been hit hard. The sudden drop in demand has forced fishers and fish farmers to get creative in their methods, turning to direct sales to stay afloat. A new tool through the University of Washington Sustainable Fisheries initiative has compiled information about where to find seafood in the form of a map that can be used to easily track down local, sustainable catch for delivery or direct sales.

The goal of the map is to support small seafood businesses by making their transition to direct sales just a little bit easier. Generally a supplier (fishing boat or farm) will deal with processors and distributors to sell their fish, and customers will purchase through a restaurant or grocery store.

Now that direct sales are the only option, the industry is scrambling to keep up and adapt to a new way of business and the map is meant to shoulder some of the burden. “They’re bringing in people from sales to pack boxes, the last thing they should have to worry about is finding new markets,” says Jack Cheney; a senior project manager at seafood sustainability organization FishWise, and contributor for Sustainable Fisheries UW, a grant-funded website dedicated to explaining the science of seafood, “this is the least we can do to try and promote them in some small way.”

Read the full story at Forbes

Does the dramatic increase in tuna catches mean extinction is around the corner? No.

October 11, 2019 — The following is an excerpt from a story originally published by Sustainable Fisheries UW:

Over the last week there have been multiple news stories saying that we are harvesting tunas at unprecedented and unstainable rates—some stories have implied that tunas are on track for extinction. This is simply not true. Most of the time, catches are not a reliable indicator of abundance.

The news articles were based on a recent paper that showed that global catches have increased more than 1,000% over the past 60 years. That statistic sounds large and scary, but it is the poor understanding of how fisheries develop that is scariest.

Fisheries develop, just like other products and industries

The increase in tuna catches reflects the classic behavior of any developing fishery. Throughout history, catches increase until they level out or until they start declining because of two potential reasons: 1. abundance of populations goes down and therefore with the same fishing effort catches go down, or 2. fisheries management is put in place to reduce fishing effort and therefore catch goes down. In the case of industrial tuna fisheries, it is not surprising that tuna’s catches increased since 1950, because this is when these fisheries started.

Global catches of large commercial tuna species from 1950 to 2017. SKJ = skipjack tuna, BFT = bluefin tuna, BET = bigeye tuna, ALB= albacore tuna. PBF= pacific bluefin tuna, SBF = southern bluefin tuna. Updated from: Pons et al. 2017. Effects of biological, economic and management factors on tuna and billfish stock status.

Moreover, recent catches are not increasing very fast. In 2017, total tuna catches were only 18% higher than in 2000. Most of this increase was generated by an increase in skipjack tuna catches, the most productive of all the major tuna species. Further, skipjack are fished at sustainable levels in all Oceans (see figure below). Are we driving skipjack tuna to extinction or even overfishing them? Definitely not.

Read the full story at Sustainable Fisheries UW

New Study Shows How Much Fish Is Caught & Where

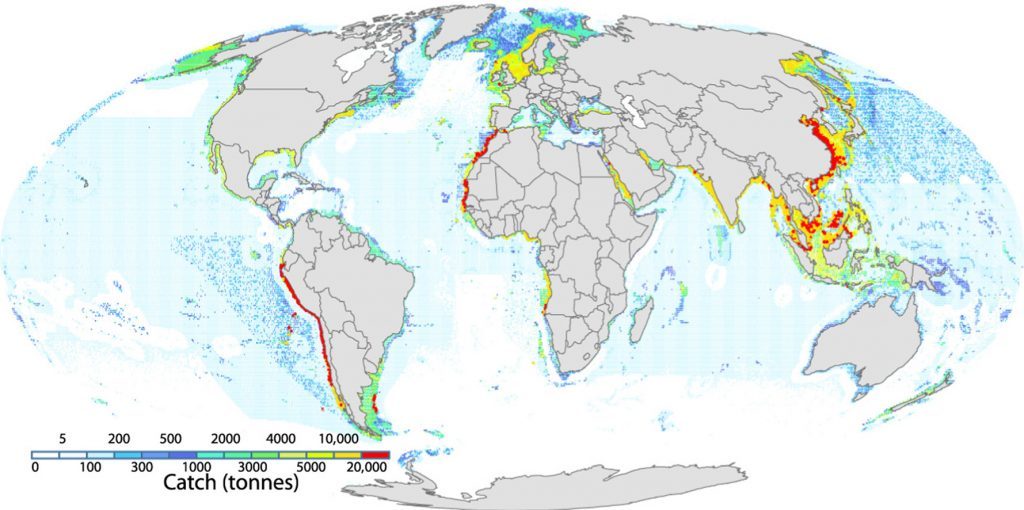
May 4 2018 — May 4, 2018 — In February, a paper published in Science Magazine mapped the “footprint” of fisheries, showing that fishing vessels are fishing in 55% of the world’s oceans. While some concluded that this study indicated immense overfishing, critics pointed out that the study did not show the intensity of fishing. However, a new paper in Marine Policy does show how much fish is caught and where. This new study is a true map of global fisheries.

The following is excerpted from an article published yesterday by Sustainable Fisheries UW:

A new paper out in Marine Policy ($) gorgeously illustrates global fisheries over the past 150 years. The figures tell the story and are cool as hell:

Where is fish caught?

Geographical representation of where fish is caught. Areas shaded by amount of catch in metric tons.

This is one of the coolest figures we’ve ever seen. You can see that areas with lower catch (like the high seas) correlate to areas with lower primary productivity—we go into further detail about primary productivity and fisheries here, in Seafood 101. A few weeks ago a different paper was published in Science that mapped the “footprint” of fisheries, essentially showing where fishing boats travel in the ocean. The paper was criticized for failing to show what the above figure shows clearly: how much fish is caught where. This is the true map of global fisheries.

Read the full story at Sustainable Fisheries UW


Recent Headlines

  • Biden backs sanctuary status for Remote Pacific Islands waters
  • NEW JERSEY: Van Drew holds hearing on wind farm, calls it collusion of big government and industry
  • MASSACHUSETTS: Cape Lobstermen Would Rather Wait Than Switch
  • Commercial Fishing Vessel Owner Cost Survey Now in the Field
  • NEW JERSEY: Congressman Slams Biden, Murphy For ‘Shoddy’ Offshore Wind Farm Strategy In New Jersey
  • What’s next after court ruling scuttles Gulf reporting system for charter boats?
  • US FDA releases report outlining how it plans to keep seafood imports safe
  • Bumble Bee Foods to remove labor claims from marketing materials

Most Popular Topics

Alaska Aquaculture ASMFC Atlantic States Marine Fisheries Commission BOEM California Climate change Coronavirus COVID-19 Donald Trump groundfish Gulf of Maine Gulf of Mexico Illegal fishing IUU fishing Lobster Maine Massachusetts Mid-Atlantic National Marine Fisheries Service National Oceanic and Atmospheric Administration NEFMC New Bedford New England New England Fishery Management Council New Jersey New York NMFS NOAA NOAA Fisheries North Atlantic right whales North Carolina North Pacific offshore energy Offshore wind Pacific right whales Salmon Scallops South Atlantic Tuna Western Pacific Whales wind energy Wind Farms

Daily Updates & Alerts

Enter your email address to receive daily updates and alerts:
  • This field is for validation purposes and should be left unchanged.
Tweets by @savingseafood

Copyright © 2023 Saving Seafood · WordPress Web Design by Jessee Productions